Oil analysis skills
The 87% Viscosity Drop That Wasn’t
A hydraulic-oil chart plunges from 67.8 to 8.8. Open the lab report and one column heading changes the diagnosis.

In this article
A drop from 67.8 to 8.8 mm²/s would get anyone’s attention on a hydraulic-oil trend. Before you call the plant, open the lab report and put your finger on the heading above 8.8. In this worked example it says 100 °C. The chart says 40 °C.
Both cells contain kinematic viscosity. Both use the same units. The mix-up survives a quick glance because the one detail that distinguishes the measurements was left behind when someone copied the number.
One oil, two temperatures
You can see how large the gap can be without taking a used-oil sample. Look up Mobil DTE 26 Ultra in ExxonMobil’s product sheet. The same fresh hydraulic oil is listed at 68.6 mm²/s at 40 °C and 8.9 mm²/s at 100 °C. Both values were measured by ASTM D445.
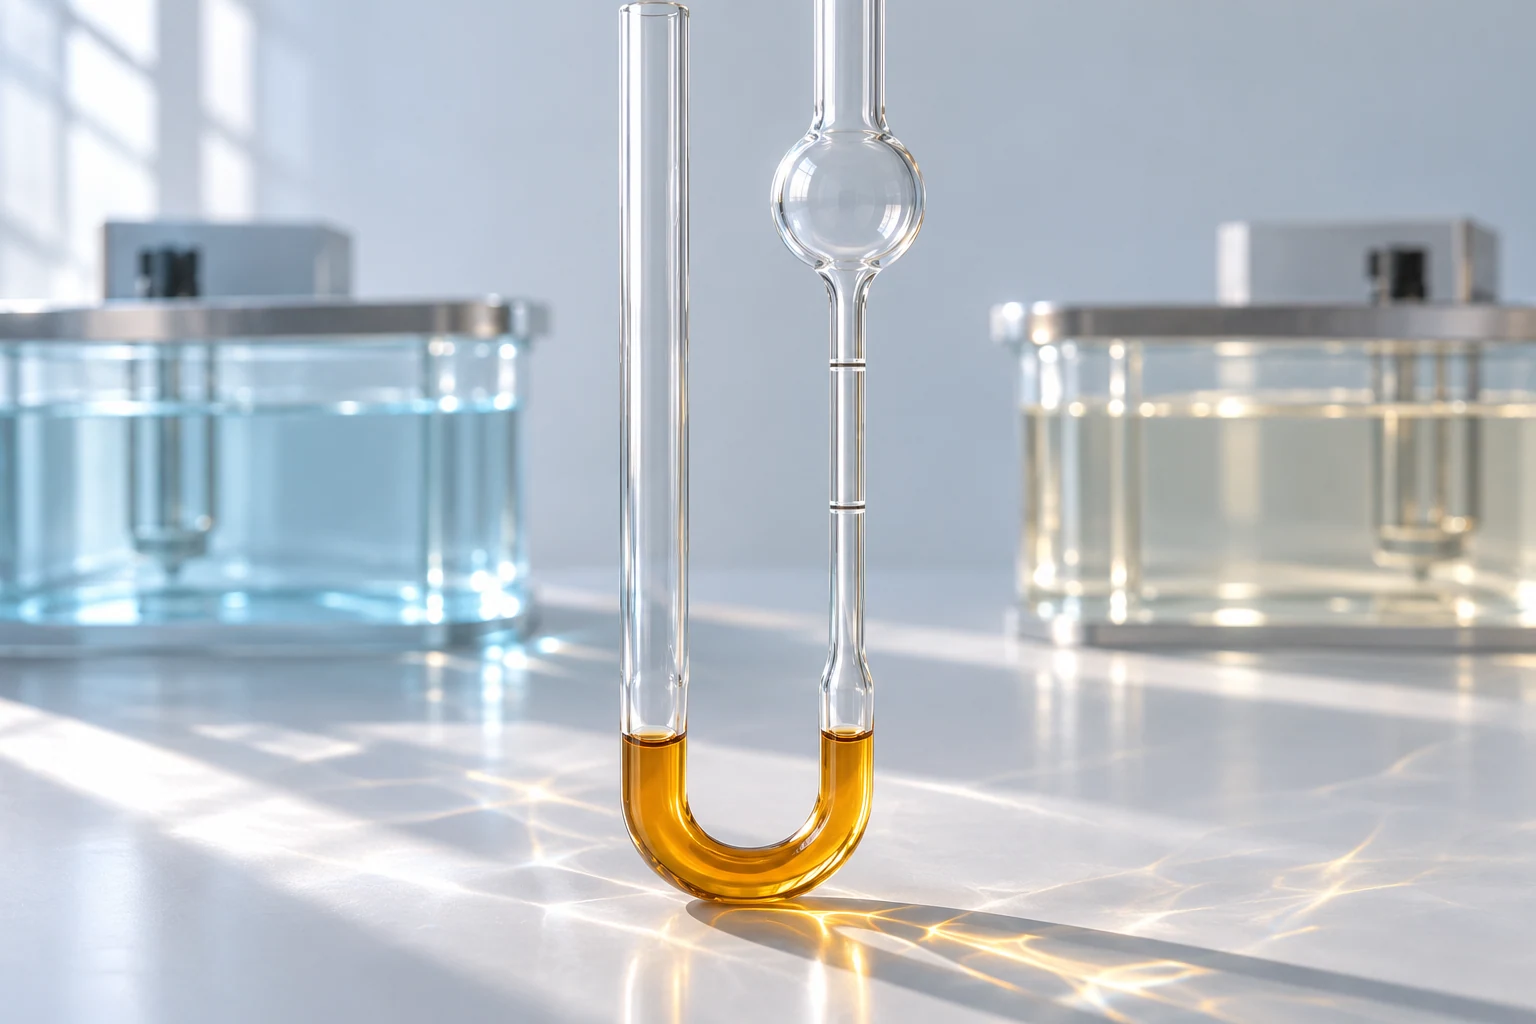
A capillary viscosity test times how long oil takes to flow through a calibrated glass tube under gravity. Warm oil flows more readily. The temperature belongs to the measurement just as much as the unit does. A column headed only “viscosity” gives the next person half the information they need.
Put the three results back on the page
Return to the example. The earlier sample was tested at 40 °C. The lab still has material from the latest sample and can repeat the measurement at that same temperature with the same method. Now there are three results to file.
| Sample and test | Temperature | Kinematic viscosity |
|---|---|---|
| Earlier sample | 40 °C | 67.8 mm²/s |
| Latest sample, original test | 100 °C | 8.8 mm²/s |
| Latest sample, repeat test | 40 °C | 66.9 mm²/s |
- Sample and test
- Earlier sample
- Temperature
- 40 °C
- Kinematic viscosity
- 67.8 mm²/s
- Sample and test
- Latest sample, original test
- Temperature
- 100 °C
- Kinematic viscosity
- 8.8 mm²/s
- Sample and test
- Latest sample, repeat test
- Temperature
- 40 °C
- Kinematic viscosity
- 66.9 mm²/s
At 40 °C the oil went from 67.8 to 66.9, a difference of 0.9 mm²/s, or about 1.3%. The 8.8 belongs in the 100 °C history. Keeping it there preserves a perfectly usable result and removes the apparent 87% drop from the other chart.

Whether 1.3% calls for action is a question for the laboratory’s precision, the asset’s limits and the sample history. A repeat on retained oil tells you about the oil in that bottle. If you need to know what is in the machine today, the sampling date matters too.
What to ask for on the next report
One lab may write cSt where another writes mm²/s. They are numerically equal. Relabelling 8.8 mm²/s as 8.8 cSt leaves the measurement at 100 °C. And if the report gives dynamic viscosity in mPa·s, converting it to kinematic viscosity requires the fluid’s density at the same temperature.
Give the trend a heading you could send to a colleague without explaining it over the phone. “Hydraulic return line | kinematic viscosity at 40 °C | mm²/s” would do. Keep the method and original report with each entry. When a value arrives without its temperature, leave it off the chart until the lab can identify the column it came from.
References
- ExxonMobil, Mobil DTE 20 Ultra Series product data. See the DTE 26 Ultra column for the two fresh-oil viscosity values.
- ISO 3104:2023, determination of kinematic viscosity. The public abstract explains the capillary measurement and the role of density in calculating dynamic viscosity.
- Anton Paar, Basics of viscometry. The kinematic viscosity section gives the equivalence between centistokes and mm²/s.